The Big Story
Florida Statewide Market Overview | December 2025
As 2025 came to a close, Florida’s housing market finished the year on a stronger note than many expected. After a slow start marked by declining sales and rising inventory, conditions improved midyear as mortgage rates eased by more than half a percentage point and growth in insurance costs continued to slow. Those changes had a meaningful impact on buyer activity across much of the state.
December marked the fifth consecutive month of year over year growth in new pending sales for single family homes, with contracts up roughly 5.5% compared to the same month last year. That represents the longest streak of rising pending sales since the height of the pandemic market in 2021. This momentum carried through to closings as well, with single family closed sales in December up nearly 6% year over year. Perhaps the biggest surprise of the year was that total single family home sales for all of 2025 ended slightly higher than 2024, finishing up just under 1% statewide. Sales strength was most notable in areas such as the Central Panhandle, the Nature Coast, The Villages and much of Southwest Florida, while declines in higher population counties were generally modest.
Total dollar volume for single family home sales reached approximately $155 billion in 2025, the third highest level on record. When adjusted for inflation, dollar volume was essentially flat, placing 2025 in line with several recent strong years. The condo and townhouse market, however, continued to face more headwinds. New safety regulations and reserve requirements have increased ownership costs and complicated financing in some cases. While the condo and townhouse segment also saw a five month streak of improving pending sales to end the year, including a strong increase in December, it was not enough to offset earlier declines. As a result, total condo and townhouse sales finished 2025 down nearly 6% compared to 2024, with annual dollar volume down more than 8%.
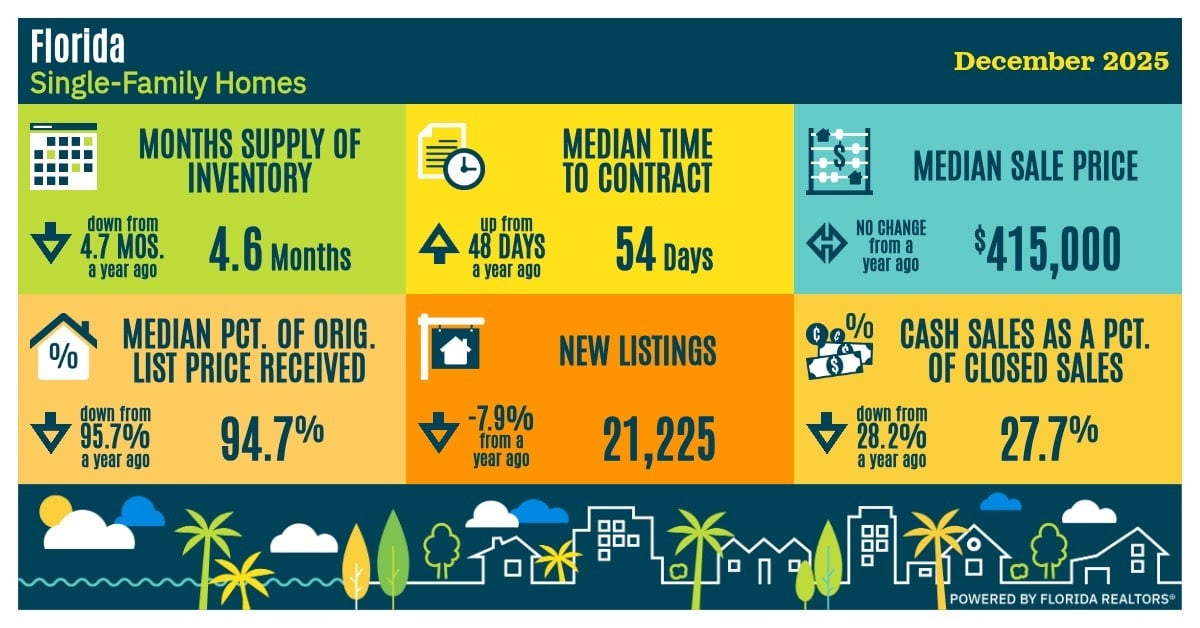
On the supply side, single family listings surged early in the year, setting monthly records from January through April. That pace slowed significantly as the year progressed, with new listings down year over year in most of the remaining months. By year end, total new single family listings were only slightly higher than 2024. Inventory followed a familiar pattern, rising through the spring before declining through much of the second half of the year as sales improved. Statewide, single family inventory finished 2025 at roughly the same level as the year prior, although local results varied widely. Importantly, inventory levels remain well below historical highs and are roughly half of what they were in 2008.
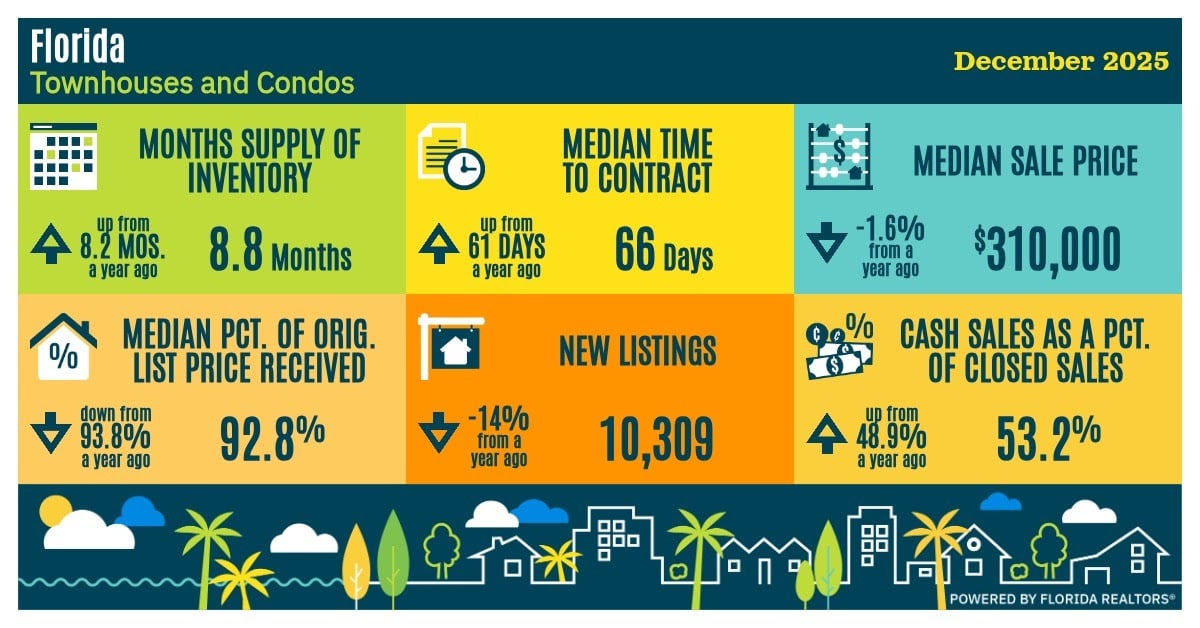
The condo and townhouse market showed a similar seasonal inventory pattern, with inventory modestly higher year over year but still far below peak levels seen during the last housing downturn. Longer marketing times continue to weigh more heavily on condos than single family homes, which helps explain why pricing trends have been weaker in that segment.
Home prices reflected these dynamics. Single family median prices stayed relatively stable throughout the year and ended December unchanged from a year earlier at approximately $415,000. Condo and townhouse prices experienced consistent year over year declines in 2025, though the gap narrowed toward the end of the year. In December, the median condo and townhouse price was down just 1.6% year over year, the smallest decline seen all year.
Overall, 2025 turned out to be a year of stabilization and gradual recovery, especially in the single family market. As the market moves into 2026, mortgage rates, affordability and local inventory conditions will remain key factors to watch.
As always, statewide trends can mask important local differences, so reviewing neighborhood level data remains essential when evaluating opportunities in today’s market. If you’d like to explore what these trends mean for your real estate goals, whether you’re buying, selling, or just keeping an eye on the market, I'm always here to help!
Quick Take — December 2025 Market Overview
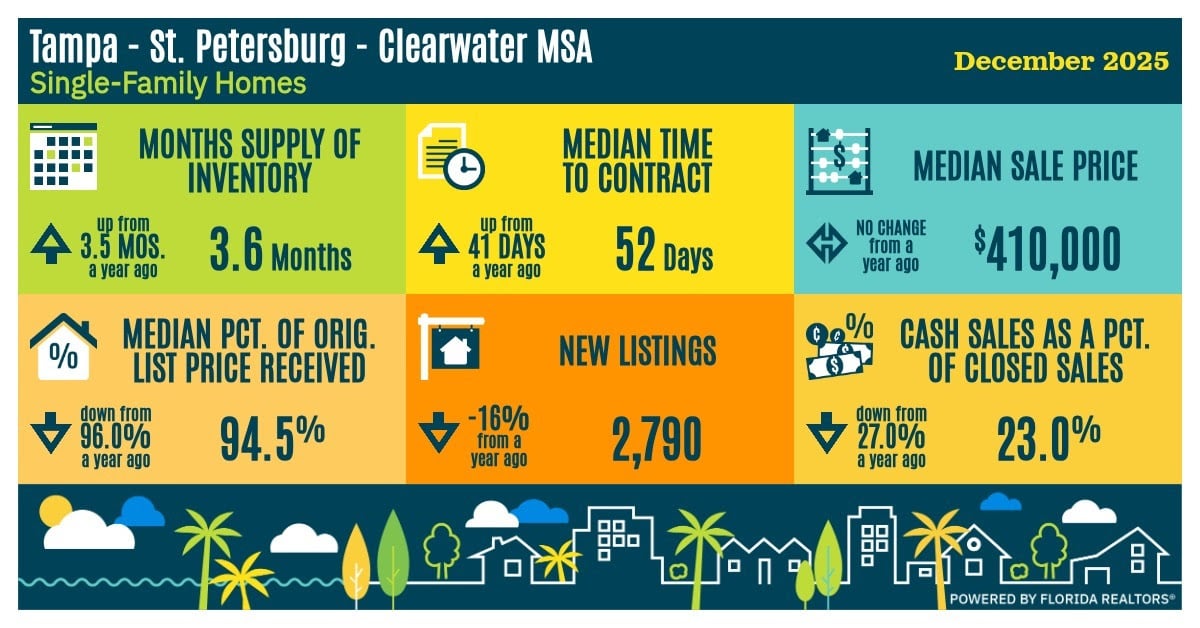
The Tampa Bay housing market wrapped up 2025 with a mixed performance across property types. Inventory levels remain elevated compared to last year, and time on market has stretched for both single-family homes and condos. Price trends are stabilizing in the single-family segment, while condos saw modest year-over-year appreciation. Buyer demand appears concentrated, especially among cash buyers in the multifamily space.
-
Months Supply of Inventory: 3.6 months, up from 3.5 months in December 2024.
-
Median Sale Price: $410,000, unchanged from a year ago.
-
Median Percentage of Original List Price Received: 94.5%, down from 96.0%.
-
Median Time to Contract: 52 days, up from 41 days.
-
New Listings: 2,790, a 16% decrease year-over-year.
-
Cash Sales as a Percentage of Closed Sales: 23.0%, down from 27.0%.
-
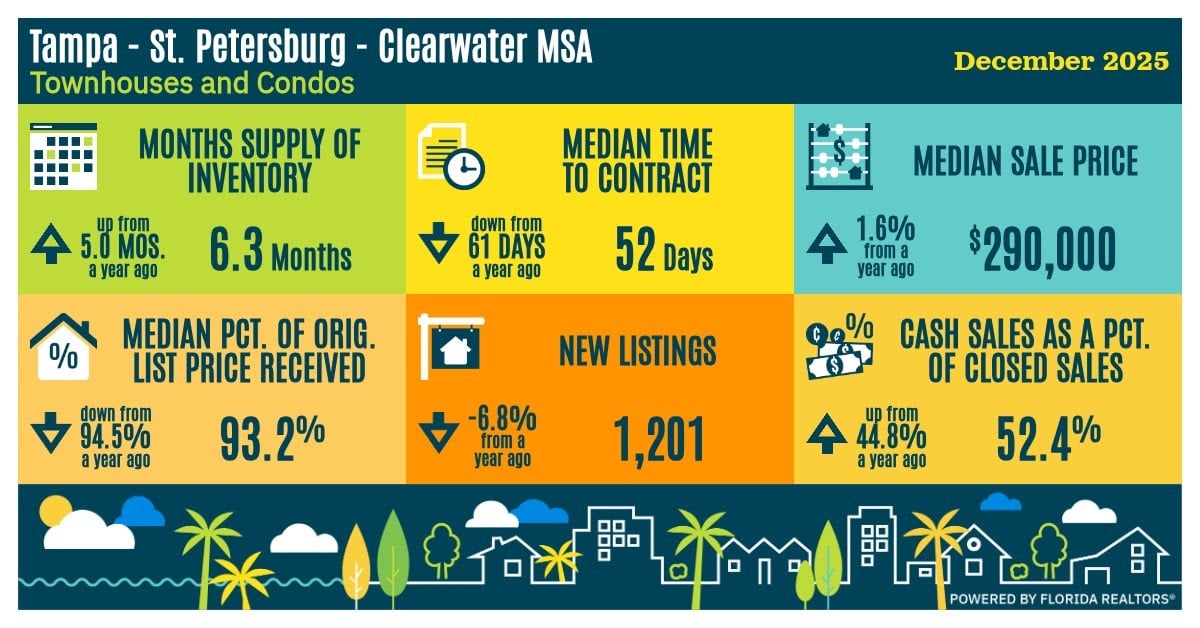
Months Supply of Inventory: 6.3 months, up from 5.0 months in December 2024.
-
Median Sale Price: $290,000, a 1.6% increase from $285,500 last year.
-
Median Percentage of Original List Price Received: 93.2%, down from 94.5%.
-
Median Time to Contract: 52 days, down from 61 days.
-
New Listings: 1,201, a 6.8% decline compared to last year.
-
Cash Sales as a Percentage of Closed Sales: 52.4%, up from 44.8%.
Bottom Line December data reflects a steady market overall, with a clear divide in buyer behavior across segments. Single-family homes are holding firm on price, though sellers are adjusting to longer timeframes and fewer new listings. In contrast, the condo and townhome segment continues to attract strong cash buyer interest, even as inventory expands. The market remains competitive but offers opportunities, especially for buyers ready to move quickly in early 2026.
The data presented here provides a general overview of the Tampa - St. Petersburg - Clearwater MSA and may not accurately reflect the conditions of specific property types or individual neighborhoods within the region. We encourage prospective buyers, sellers, and investors to consult with local real estate professionals who can provide detailed information and insights relevant to specific locations and property types.
Note: You can find the charts/graphs for the Local Lowdown at the end of this section.
|
|
|
Whether you're actively buying or selling, or just keeping an eye on the market, we're here to provide clear, timely insight tailored to your goals.
Each month, I share a quick update on what’s happening across Florida’s housing market, both statewide and locally, so you can stay informed and make confident decisions. If you’re curious how these trends might affect your plans, or just want to talk strategy, I’d love to connect.