Leave a Message

Thank you for your message. We will be in touch with you shortly.

Florida Real Estate Newsletter - March 2026 📈

Real Estate

Tampa Bay Housing Market Update

The Big Story

Florida Statewide Market Overview | February 2026

Florida’s housing market continued to show signs of stabilization and gradual improvement in February, according to the latest data from Florida Realtors. Closed sales increased for the sixth consecutive month, while pricing remained relatively steady across both major property types.
 
Single family home sales rose nearly 4% year over year in February, building on January’s strong performance. This marks six straight months of annual growth, with sales increasing in 16 of Florida’s 22 metro areas. Condo and townhouse sales also posted their sixth consecutive month of gains, climbing more than 8.5% year over year. While that increase outpaced single family homes at the statewide level, results were more mixed locally, with only half of metro areas seeing growth in this segment.
 
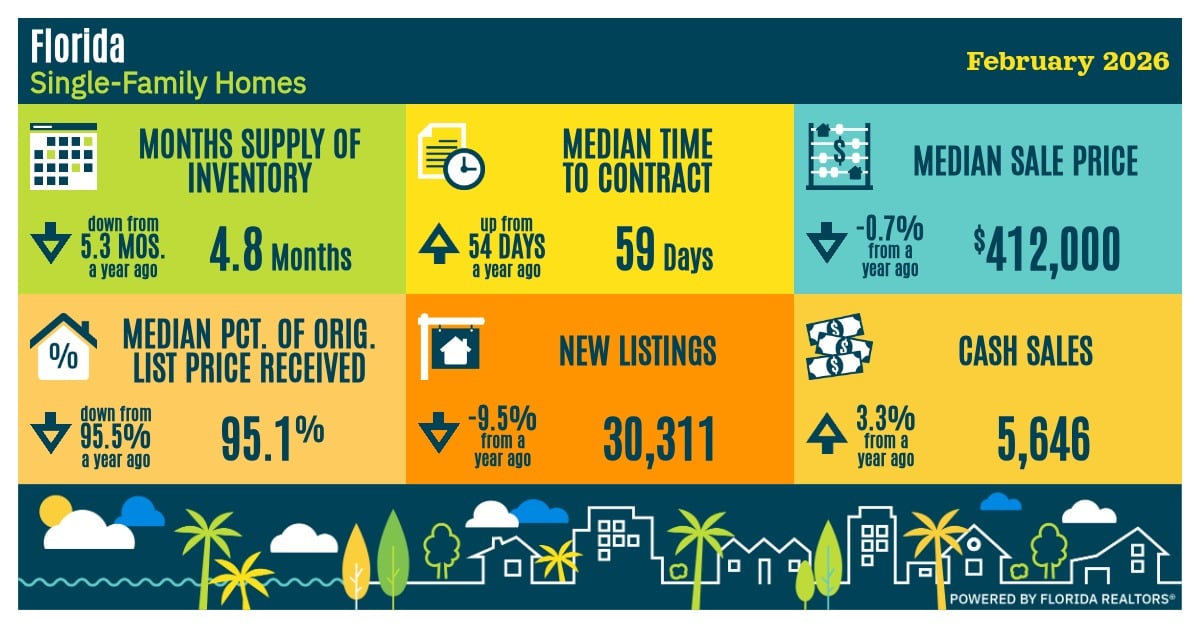
On the supply side, the surge in new listings seen at the start of the year eased in February. Single family new listings declined 9.5% year over year, while condo and townhouse listings fell more than 15%. Despite these declines, listing activity remains in line with pre-pandemic norms, suggesting a return to more typical seasonal patterns rather than a true pullback in supply.
 
Buyer activity also moderated slightly from January’s surge. New pending sales of single family homes were up about 4% year over year in February, down from stronger gains the prior month. Condo and townhouse pending sales rose just over 9%, also reflecting a more normalized pace of demand following an active start to the year.
 
One of the more notable shifts in February was on inventory. After a prolonged period of rising inventory since 2022, available listings declined year over year for the first time in several years. Single family inventory fell more than 7.5% compared to last year, with similar declines seen in the condo and townhouse segment. This tightening in supply is helping support current pricing trends.
 
Home prices remained relatively stable. The median sale price for single family homes was $412,000, down less than 1% year over year. Condo and townhouse prices came in at $309,000, down just under 2%.
 
Overall, February data suggests the Florida housing market has moved past its recent slowdown and is transitioning into a more balanced environment. Sales are trending upward, inventory growth has leveled off, and pricing remains steady. As always, local market conditions can vary, making it important to evaluate trends at the neighborhood level. If you’d like to explore what these trends mean for your real estate goals, whether you’re buying, selling, or just keeping an eye on the market, I'm always here to help!
 

Florida Data


Local Lowdown

Quick Take — February 2026 Market Overview

 
The Tampa–St. Petersburg–Clearwater MSA housing market continued its gradual shift toward balance in February 2026. Inventory levels remain elevated, particularly in the condo and townhome segment, while pricing showed modest improvement from January. Buyer activity appears steady, with contract times holding firm month-over-month but still slower than last year. Overall, the market is stabilizing, though sellers are facing more competition and buyers continue to gain leverage.
 
In the single-family home segment, inventory held steady at 3.8 months, unchanged from last year and slightly down from 3.9 months in January. The median sale price rose to $404,000, up 1.0% year-over-year and rebounding from $386,500 in January. Homes are going under contract in 54 days, up from 50 days in January and 44 days last year. New listings declined to 4,164, down from 4,855 in January and 9.4% below last year. Cash sales also decreased from January levels and remain down 23% year-over-year, signaling continued softness in investor activity.
 
The condo and townhome segment remains more supply-heavy, with inventory rising to 7.0 months, up from 6.8 months in January and 6.1 months last year. The median sale price increased to $297,000, up 4.2% year-over-year and improving from $285,517 in January. Time to contract held steady at 54 days, slightly higher than 53 days in January but improved compared to 57 days last year. New listings declined from 2,159 in January to 1,827, down 8.7% year-over-year. Cash sales increased to 519, up from January and up 3.2% year-over-year, reflecting continued investor and cash buyer presence in this segment.
 
Single-Family Homes
  • Months Supply of Inventory: 3.8 months. Slightly down from 3.9 in January and unchanged year-over-year.
  • Median Sale Price: $404,000. Up from $386,500 in January and up 1.0% year-over-year.
  • Median Percentage of Original List Price Received: 95.4%. Up from 94.8% in January but down from 95.8% last year.
  • Median Time to Contract: 54 days. Up from 50 days in January and up from 44 days last year.
  • New Listings: 4,164. Down from 4,855 in January and down 9.4% year-over-year.
  • Cash Sales: 650. Up from 608 in January but down 23% year-over-year.
Townhomes and Condos
  • Months Supply of Inventory: 7.0 months. Up from 6.8 in January and up from 6.1 last year.
  • Median Sale Price: $297,000. Up from $285,517 in January and up 4.2% year-over-year.
  • Median Percentage of Original List Price Received: 94.3%. Slightly down from 94.6% in January but up from 94.2% last year.
  • Median Time to Contract: 54 days. Up slightly from 53 days in January but improved from 57 days last year.
  • New Listings: 1,827. Down from 2,159 in January and down 8.7% year-over-year.
  • Cash Sales: 519. Up from 403 in January and up 3.2% year-over-year.
 
Bottom Line:
 
February data shows a market that is stabilizing but still adjusting. Single-family homes are holding relatively firm, with pricing rebounding from January despite slower contract times. Meanwhile, the condo and townhome segment continues to carry higher inventory but is seeing encouraging price growth and strong cash activity. As we move deeper into the spring market, inventory levels and buyer demand will be key indicators of how competitive conditions become across Tampa Bay.
 
Note: You can find the charts/graphs for the Local Lowdown at the end of this section.
 

Local Lowdown Data

 
Whether you're actively buying or selling, or just keeping an eye on the market, we're here to provide clear, timely insight tailored to your goals.
 
Each month, I share a quick update on what’s happening across Florida’s housing market, both statewide and locally, so you can stay informed and make confident decisions. If you’re curious how these trends might affect your plans, or just want to talk strategy, I’d love to connect.
 

Let’s Talk

You’ve got questions and we can’t wait to answer them.