Florida and Tampa Bay Real Estate Market Update February 2026 📈
Real Estate

Real Estate
While national headlines recently pointed to a decline in existing home sales to start 2026, Florida is telling a different story. According to the latest January data from Florida Realtors, the Sunshine State began the year with encouraging momentum across both single family homes and condos.
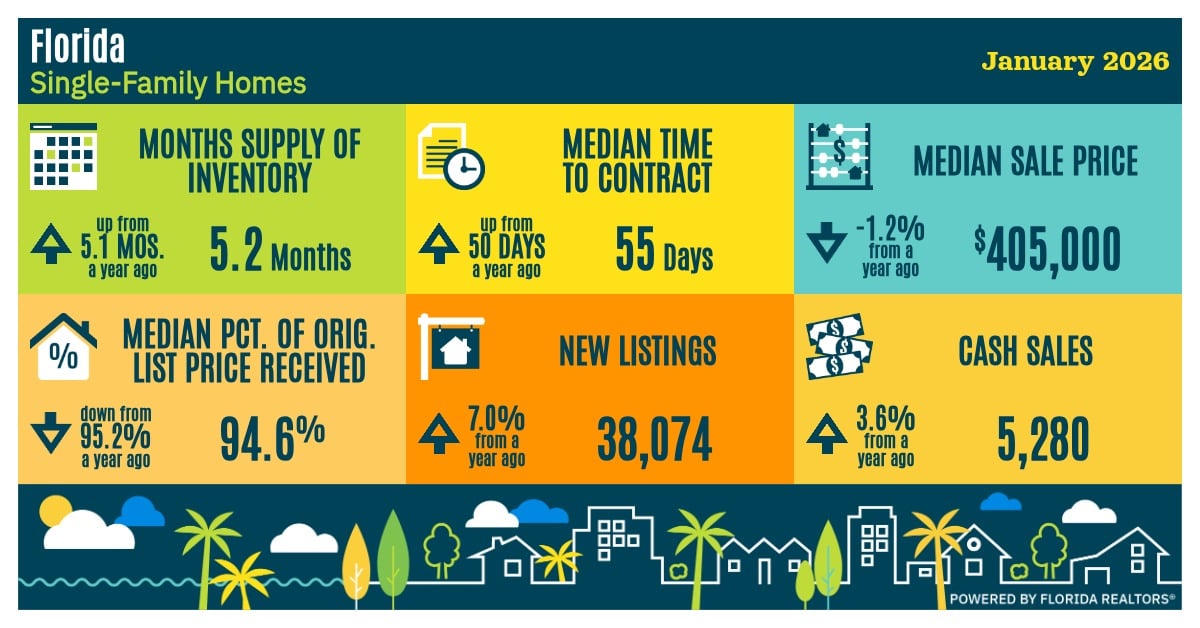
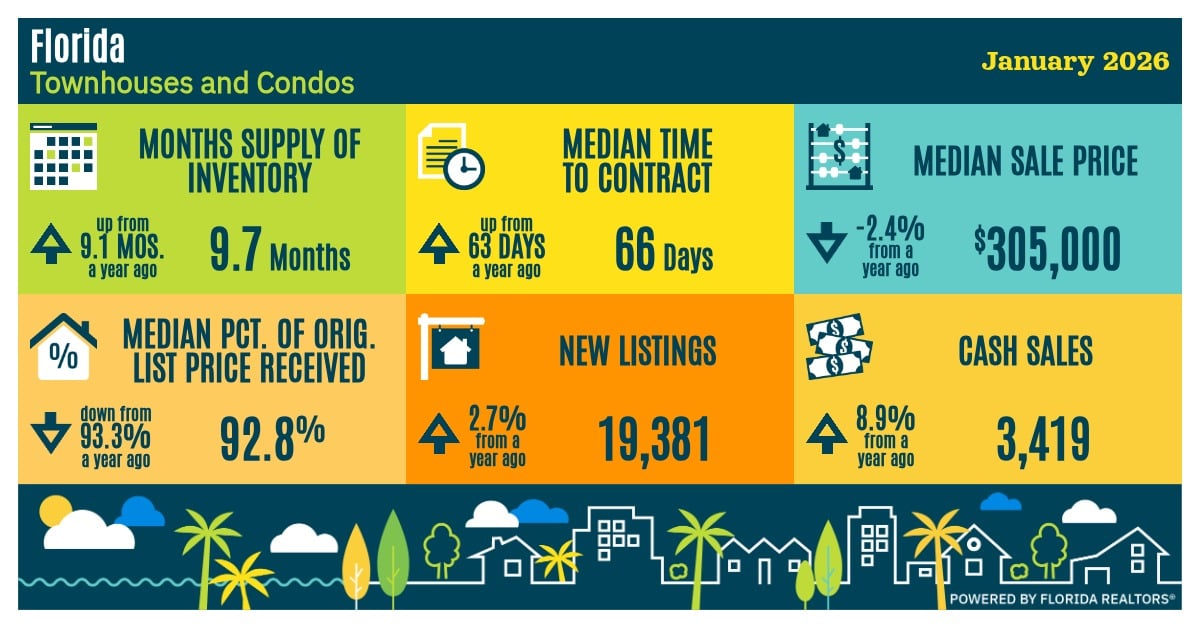
Closed sales of single family homes in Florida rose nearly 6% year over year in January, marking the fifth consecutive month of annual growth. This was the strongest January for single family closings since 2022, when mortgage rates were near historic lows. Sales increased in 16 of Florida’s 22 metro areas, underscoring broad based improvement. Condo and townhouse sales also continued their recovery, climbing just over 5% year over year. That represents the fifth straight month of gains in that segment as well, with 15 of 22 metro areas posting increases.
Listing activity also started the year at a record pace. January new listings reached the highest level for that month in data going back to 2008. Single family new listings were up 7% compared to last year, while condo and townhouse new listings increased 2.7%. It remains to be seen whether this elevated listing activity will continue throughout the year. In 2025, listings surged early before tapering off later in the year. However, with affordability modestly improved thanks to lower mortgage rates, sellers may find stronger demand this time around.
That demand is already visible in the pending sales data. New pending sales of single family homes jumped more than 15% year over year in January, marking the sixth straight month of increases and the highest January level since 2022. Condo and townhouse pending sales rose nearly 17% year over year, also extending their six month growth streak. This suggests that many homes coming onto the market are finding buyers relatively quickly.
Inventory levels increased from December to January, which is typical for this time of year as new listings hit the market. However, year over year inventory growth has slowed dramatically. Single family inventory was up less than 3% compared to January 2025, a sharp contrast to the 31% increase seen a year ago. Condo and townhouse inventory was up less than 1% year over year, compared to nearly 40% growth at the start of last year. Overall inventory levels remain well below the peaks seen during the last housing downturn.
With inventory stabilizing, home prices have remained relatively steady. The median sale price for single family homes in January was $405,000, down just over 1% year over year. Condo and townhouse median prices came in at $305,000, down about 2.5% compared to last year. While these are modest declines at the statewide level, local trends can vary, making neighborhood level data especially important.
In short, Florida’s housing market entered 2026 with solid sales growth, strong buyer activity, and stabilizing inventory. As always, understanding what is happening in your specific market is key to making informed real estate decisions. If you’d like to explore what these trends mean for your real estate goals, whether you’re buying, selling, or just keeping an eye on the market, I'm always here to help!
The Tampa–St. Petersburg–Clearwater MSA housing market kicked off 2026 with rising inventory levels and moderate price adjustments across both segments. Time to contract remains elevated compared to a year ago, while buyer behavior appears more selective.
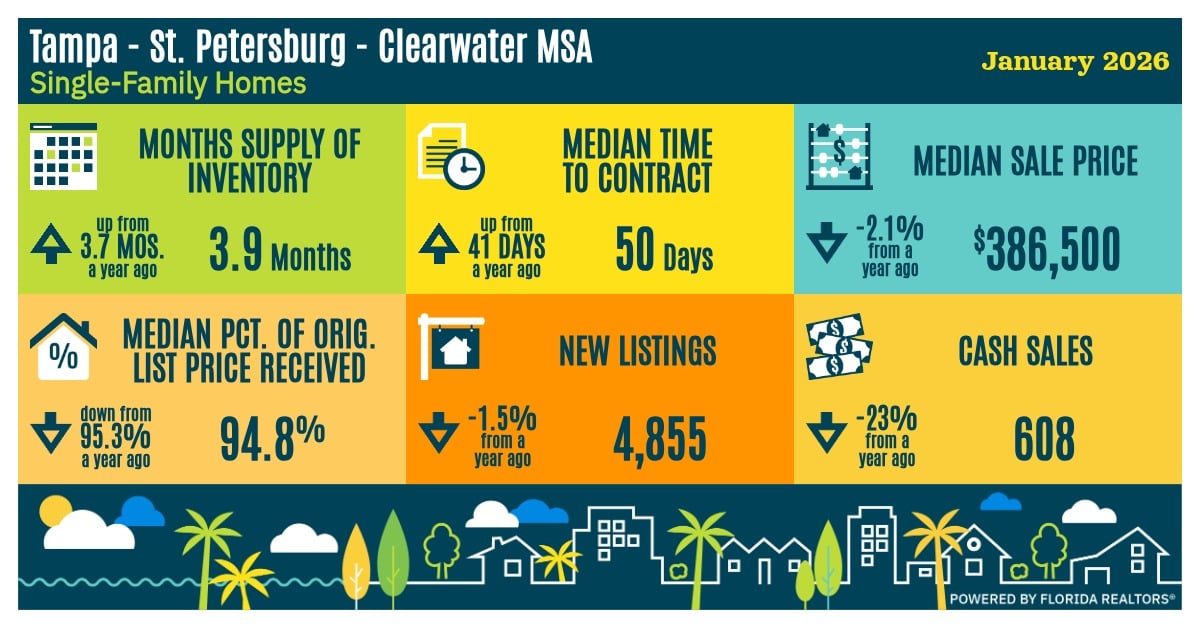
The single-family segment is showing mild price softening, while condos and townhomes posted modest year-over-year gains. Overall, the market continues shifting toward balance, giving buyers more leverage than we saw in prior years. Single-family home inventory increased to 3.9 months, up from 3.7 months a year ago. The median sale price dipped 2.1% year-over-year to $386,500. Homes are taking 50 days to go under contract, up from 41 days last year. New listings declined slightly by 1.5%, and cash sales fell 23% year-over-year, signaling a slowdown in investor-driven activity.
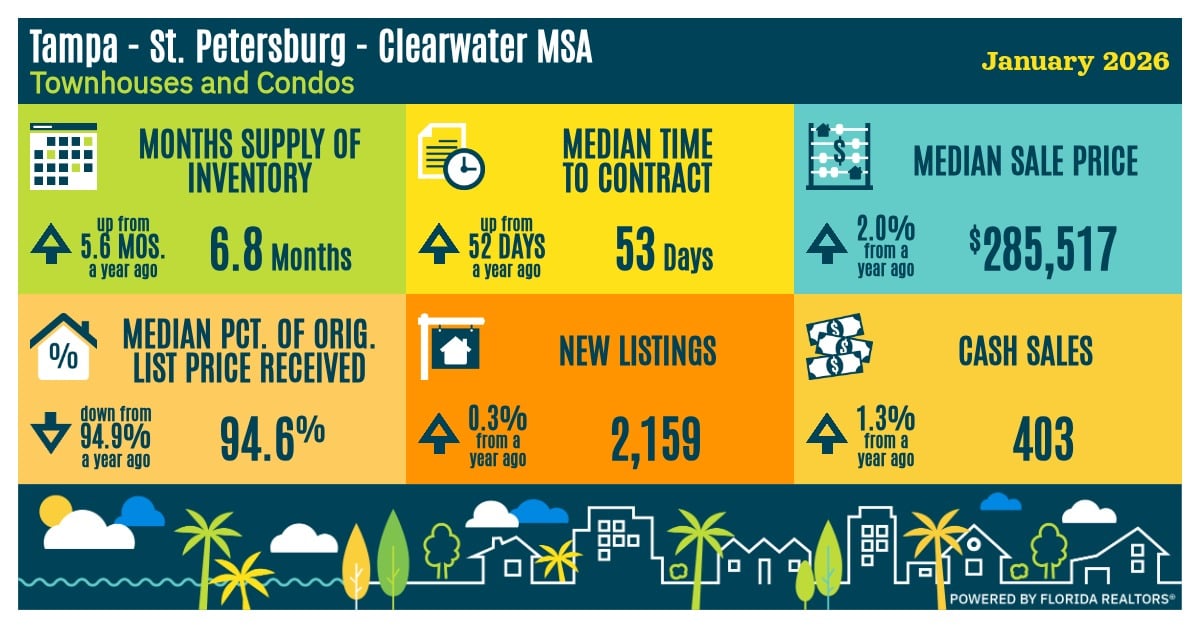
Meanwhile, the condo and townhome segment continues to operate with higher supply levels at 6.8 months of inventory, up from 5.6 months last year. The median sale price rose 2.0% to $285,517. Time to contract stretched to 53 days, up from 52 days a year ago. New listings were essentially flat, rising 0.3%, while cash sales increased 1.3%, reinforcing steady investor and downsizer participation in this space.
Single-Family Homes:
Townhomes and Condos:
Bottom Line:
January’s data reinforces the ongoing normalization of the Tampa Bay market. Inventory is building gradually, giving buyers more options, while sellers must remain strategic on pricing and presentation. Single-family pricing is adjusting slightly, whereas condos are holding value better than expected. As we move into the spring market, watch inventory and contract activity closely, as both will signal how aggressive buyers are willing to be in early 2026.
The data presented here provides a general overview of the Tampa - St. Petersburg - Clearwater MSA and may not accurately reflect the conditions of specific property types or individual neighborhoods within the region. We encourage prospective buyers, sellers, and investors to consult with local real estate professionals who can provide detailed information and insights relevant to specific locations and property types.
Note: You can find the charts/graphs for the Local Lowdown at the end of this section.
Stay up to date on the latest real estate trends.


You’ve got questions and we can’t wait to answer them.